Cartogram Generation Tutorial
1. Select a Map
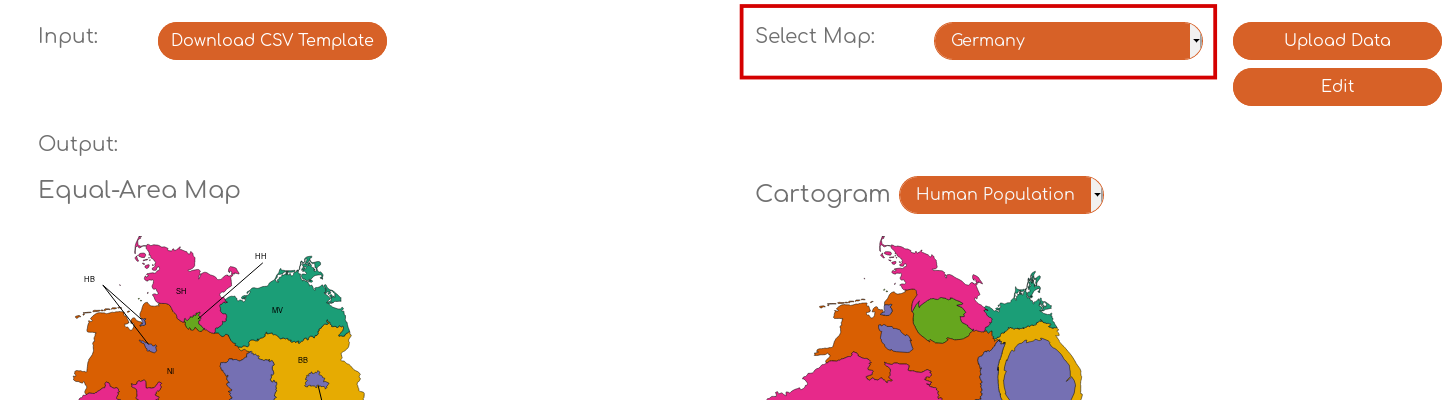
On the right-hand side of the 'Input' section, there are currently several maps to choose from. If you select a map, the display below will update to display the conventional land-area version of the map, and a population cartogram.
2. Fill In Your Data
The easiest wayt to fill in your data is to use a spreadsheet program like Microsoft Excel or LibreOffice Calc. Click the 'Download CSV Template' button on the left-hand side of the 'Input' section. You can open the downloaded template with the spreadsheet program of your choice.
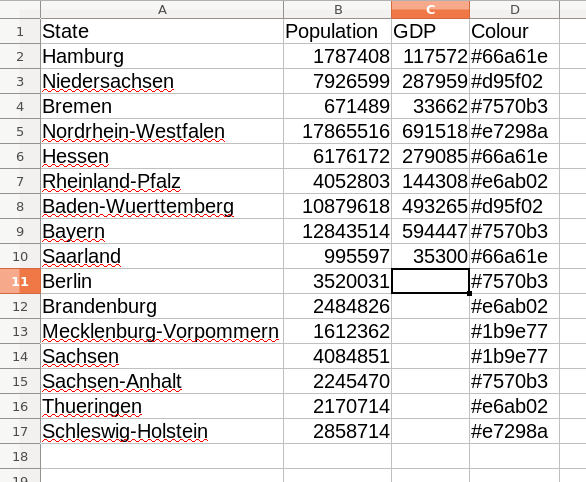
The province or state column, as well as the population column, are for reference only. You will need to insert your data into the third column, and change the header for the third column to match the name of your dataset. If you do not like the default colour scheme, you may also specify your own colour for each region by using hexadecimal colour codes.
For more information about suitable datasets and colour codes, please see the FAQ.
When you've filled in the template with your data and colour information, go back to the go-cart.io website and click 'Upload Data' in the top right corner of the website. Once you select your CSV file to upload, cartogram generation will begin. The time it takes to generate a cartogram varies, but it averages around a few seconds.
Alternatively, in a pinch you may use the built-in editing interface, which can be launched by clicking the 'Edit' button on the far right-hand side of the input section.
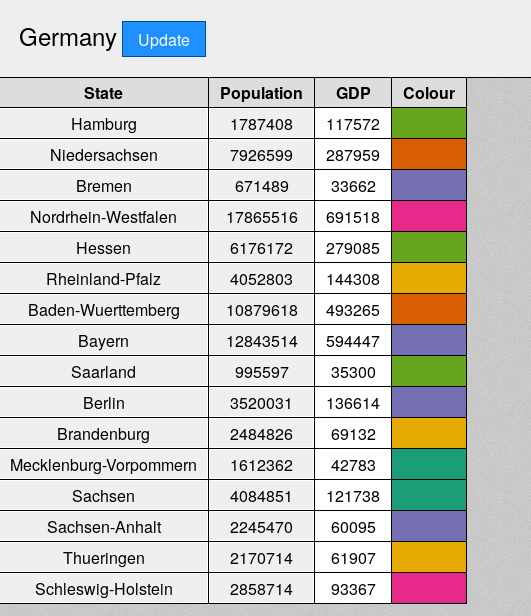
The editor interface functions like a spreadsheet program. Again, the region name and population columns are for reference only, and cannot be changed. You will need to insert your data into the third column. You should also fill in the title of your dataset into the header for the third column.
When you are done filling in your data, click the 'Update' button at the top of the editor interface to generate your cartogram.
3. View, Download, and Share Your Cartogram
When your cartogram has finished generating, our website provides several interactive tools to help you analyze it. Hovering over each region displays detailed information about that region in a tooltip. Additionally, you may switch between your cartogram, a population cartogram, and the land area map by using the dropdown in the right hand column.
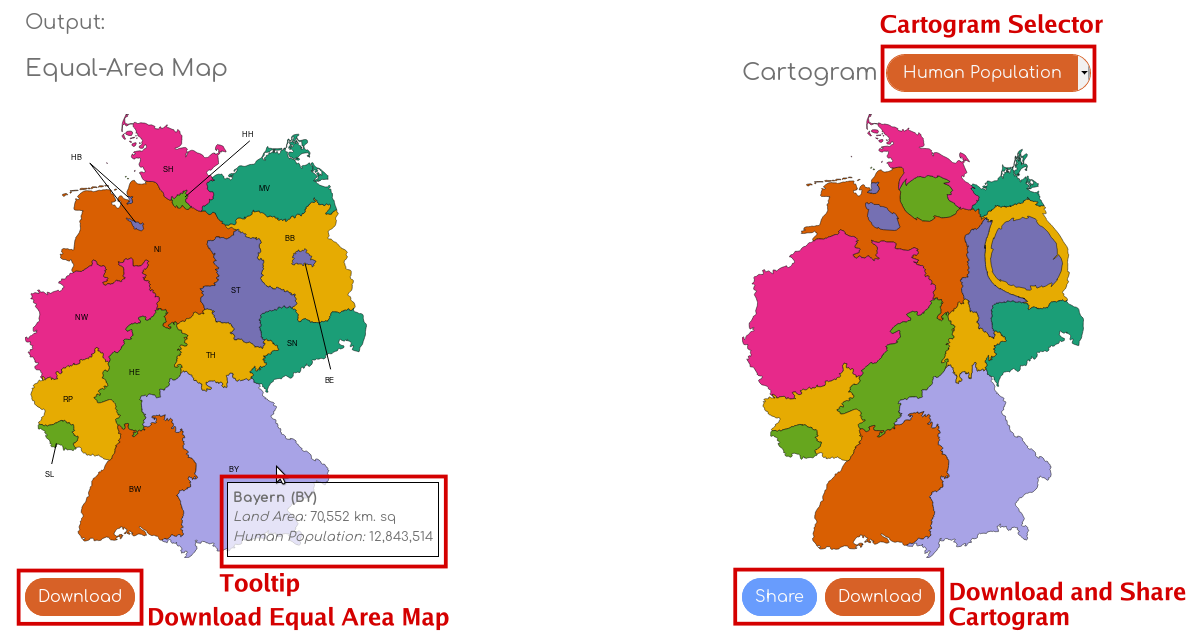
You may also download an SVG version of each of these maps by using the buttons below each map. Finally, you can also share your map on social media by using the button at the bottom of the page.